| Table 1: Train-Test Split | |||
| Set | Rows | Placed | Not Placed |
|---|---|---|---|
| Training | 8000 | 1338 | 6662 |
| Testing | 2000 | 321 | 1679 |
Model
Methodology
This page fits a logistic regression model predicting job placement from four student-level features: CGPA, IQ, internship experience, and communication skills. The goal is a clean training/testing split so the model can be evaluated on data it has never seen, rather than judged only on how well it fits the data it was built from.
Variables used in this model:
Placement— whether the student was placed in a job (Yes/No); this is the outcome being predictedCGPA— cumulative grade point average, a measure of sustained academic performance across semestersIQ— a standardized intelligence score, measuring cognitive ability independent of courseworkInternship_Experience— whether the student completed an internship (Yes/No)Communication_Skills— a rated measure of the student’s communication ability
Reference category in the model: Internship experience = No. All coefficients for Internship_ExperienceYes are interpreted relative to this baseline.
Why these four predictors: CGPA and IQ capture two different kinds of ability — sustained academic performance over time versus underlying cognitive aptitude — so together they test whether employers reward consistent effort, raw intelligence, or both. Internship experience is included because it’s often assumed to be a resume-building requirement for landing a job, making it worth testing directly rather than taking that assumption for granted. Communication skills round out the model because hiring is not just about technical ability — how well a student can present themselves plausibly matters just as much in a real interview process. Together, these four represent the major categories students are usually told to focus on: grades, intelligence, experience, and soft skills.
Equation
The fitted model uses the form:
\[ \log\left(\frac{P(\text{Placement} = 1)}{1 - P(\text{Placement} = 1)}\right) = \beta_0 + \beta_1 \cdot \text{CGPA} + \beta_2 \cdot \text{IQ} + \beta_3 \cdot \text{Internship} + \beta_4 \cdot \text{Communication} \]
What each part means:
- The left side — the log-odds of a student being placed. Log-odds is the mathematical scale logistic regression works on; it gets converted to a normal probability and to odds ratios below.
- \(\beta_0\) (intercept) — the baseline log-odds of placement when CGPA, IQ, and Communication Skills are all zero and the student has no internship. Not meaningful on its own, but needed to anchor the equation.
- \(\beta_1\) — how much the log-odds of placement change for each one-point increase in CGPA, holding IQ, internship, and communication skills constant.
- \(\beta_2\) — how much the log-odds of placement change for each one-point increase in IQ, holding the other three constant.
- \(\beta_3\) — how much the log-odds of placement change if a student has internship experience versus not, holding the other three constant.
- \(\beta_4\) — how much the log-odds of placement change for each one-point increase in communication skills, holding the other three constant.
In simple terms, each β is a weight: it says how much that one factor pulls a student’s chances up or down, assuming everything else about the student stays the same. A large positive β means that factor matters a lot; a β near zero means it barely matters at all — which is exactly what distinguishes CGPA from internship experience in this model.
Data Preparation
- The outcome
Placementis coded asYes/No - Predictors used:
CGPA,IQ,Internship_Experience,Communication_Skills - No rows required removal for missing values in these columns
Train-Test Split
The split preserves roughly the same 1-in-6 placement rate in both sets, so the model is evaluated under the same conditions it was trained on.
Logistic Regression Model
A logistic regression model was fit on the training set. The model uses a logit link, which is appropriate for a binary outcome.
Model Summary
| Table 2: Model Summary | ||||
| Term | Estimate | Std Error | z value | p value |
|---|---|---|---|---|
| CGPA | 1.0741 | 0.0367 | 29.2976 | 0.0000 |
| IQ | 0.0946 | 0.0034 | 27.7625 | 0.0000 |
| Internship_ExperienceYes | 0.0128 | 0.0813 | 0.1572 | 0.8751 |
| Communication_Skills | 0.5453 | 0.0184 | 29.5955 | 0.0000 |
CGPA, IQ, and communication skills all show large coefficients with p-values near zero, indicating strong, reliable effects. Internship experience shows a coefficient close to zero with a large p-value, indicating no reliable effect once the other three predictors are already known.
Odds Ratios with Confidence Intervals
| Table 3: Odds Ratios and 95% Confidence Intervals | ||||||
| term | Odds Ratio | std.error | statistic | p.value | CI Low | CI High |
|---|---|---|---|---|---|---|
| CGPA | 2.927 | 0.037 | 29.298 | 0.000 | 2.727 | 3.149 |
| IQ | 1.099 | 0.003 | 27.763 | 0.000 | 1.092 | 1.107 |
| Internship_ExperienceYes | 1.013 | 0.081 | 0.157 | 0.875 | 0.863 | 1.187 |
| Communication_Skills | 1.725 | 0.018 | 29.596 | 0.000 | 1.665 | 1.790 |
An odds ratio above 1 indicates higher odds of placement; a value overlapping 1 indicates no meaningful effect. CGPA shows the largest effect, followed by communication skills, then IQ. Internship experience’s interval crosses 1, meaning it cannot be distinguished from having no effect at all.
An odds ratio is just a more intuitive way to express the β values above: for every one-point increase in a factor, a student’s odds of being placed get multiplied by that number. An odds ratio of 2 means each extra point roughly doubles the odds of placement; an odds ratio near 1 means that factor changes almost nothing. The confidence interval shows the realistic range the true value could fall in — when that range crosses 1, as it does for internship experience, the effect can’t be distinguished from noise.
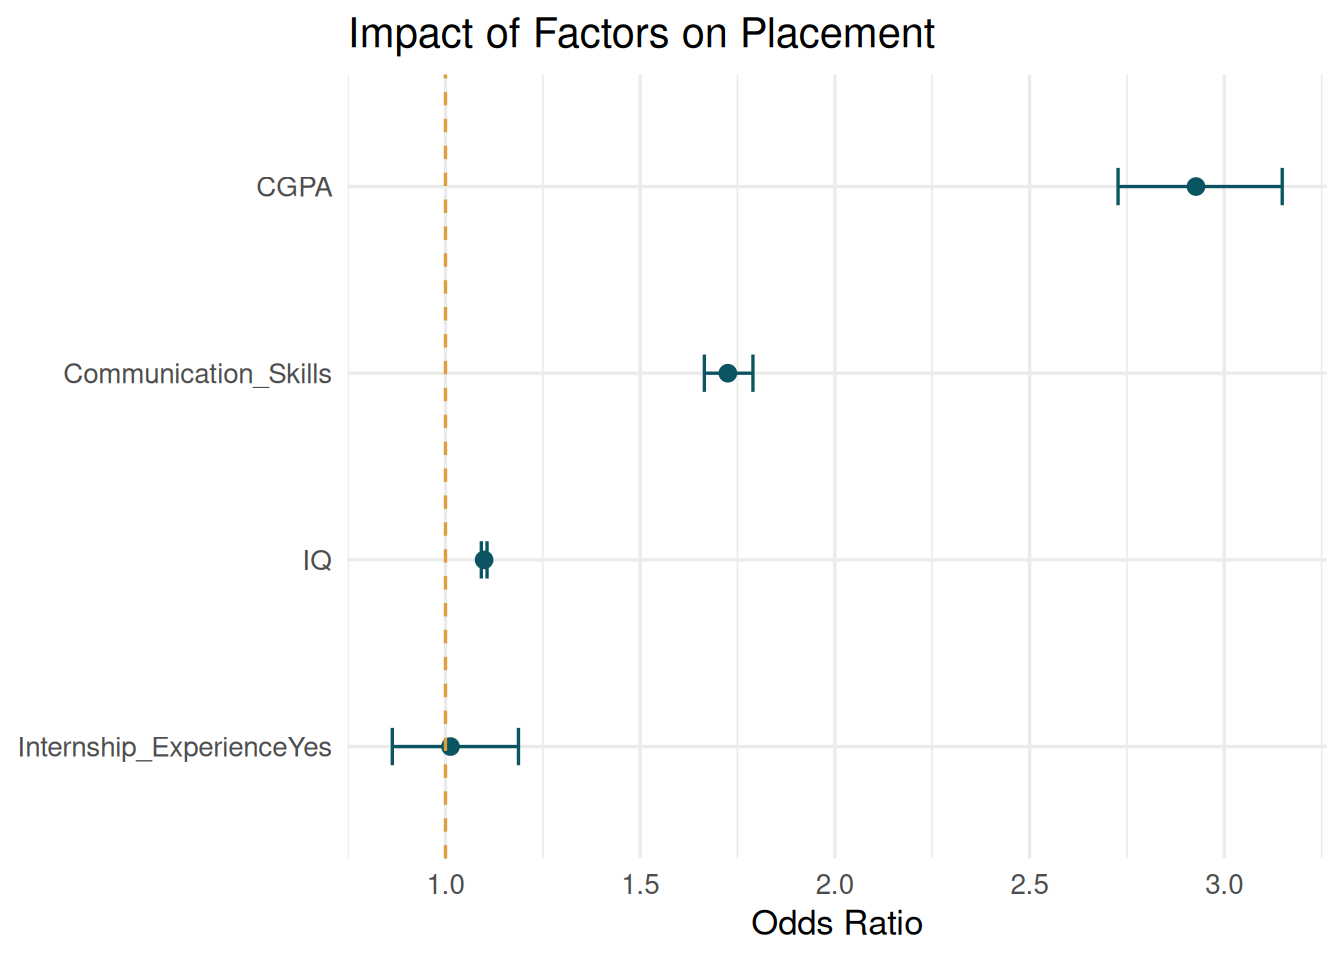
Any factor whose line crosses the dashed reference at 1 cannot be confidently said to affect placement. CGPA, IQ, and communication skills sit clearly to the right of that line; internship experience straddles it.
Model Performance
| Table 4: Held-Out Test Performance | |
| Metric | Value |
|---|---|
| Test Accuracy | 88.4% |
| Baseline Accuracy (majority class) | 84.0% |
The model correctly classifies placement outcomes 88.4% of the time on students it never saw during training, compared to a 84.0% baseline from guessing the majority outcome for everyone. This is a modest improvement over simply guessing the majority class, so the model should be read as a descriptive summary of the relationships in this data rather than a strong stand-alone predictive tool.
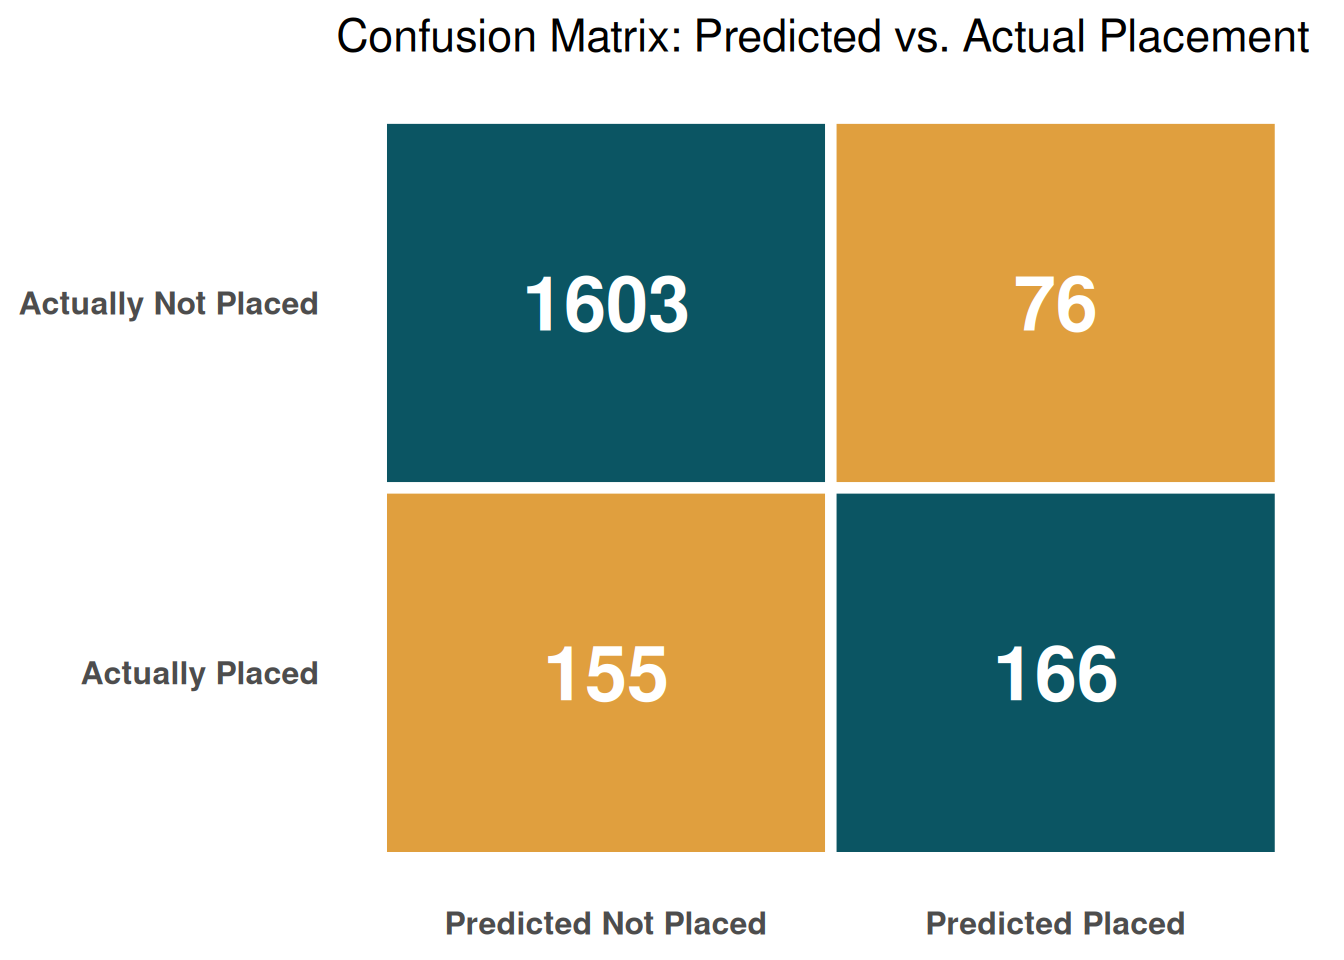
Teal squares are where the model got it right; orange squares are where it got it wrong. The diagonal is always the “correct” diagonal — reading a confusion matrix is just checking how big the teal squares are compared to the orange ones.
Interpretation
- Odds ratios above 1 mean higher odds of placement, holding the other predictors constant
- CGPA is the strongest predictor, followed by communication skills, then IQ
- Internship experience shows no reliable effect once the other three factors are accounted for
- The model performs meaningfully better than the baseline on held-out data
- This is a predictive model, not a causal one — it does not establish that raising a student’s CGPA would cause placement, only that the two are strongly associated